Call Center Reporting
Discover the advantages of using reports to monitor and improve call center performance.
Table of Contents
WARNING: Call Center Reporting is for Call Queues. Call Queues must have their Statistics option set to “Yes”.
This will allow Stratus to collect statistics for the call queue.
Enable Call Statistics Tracking for Call Queues
In order for statistics to be recorded, your call center's call queues will need to have Statistics enabled in their Basic settings.
To enable the collection of call statistics for call queues…
1. Navigate to the Call Queues page.
2. Click the Edit Queue  icon next to the call queue that needs adjustment.
3. In the Basic tab, use the Statistics drop-down to select Yes.
4. Click the Save button.
Access the Call Center Page
The Call Center page can be accessed by clicking the Call Center tab on the tab bar.![]()
Scope: Call Center Supervisors, Site Managers, and Office Managers can generate and reference call center reports.
Some features may not be available to all users depending on their user scope permissions.
The Stats Grid
On the Call Center page of the Stratus Web Portal, a Stats Grid can be viewed for a quick summary of your call center's performance. This grid displays certain statistics. Some of these statistics shown may be color-coded as a way to show if this particular statistic is meeting any set thresholds.

The colors in the grid indicate the following:
- Green - value is within an acceptable range.
- Yellow - value is within the range of your lower threshold.
- Red - value meets or exceeds your upper threshold.
- White - no thresholds are configured for the statistic.
Adjust the Stats Grid
1. Click GRID SETTINGS to adjust the stats shown on the grid and its color warnings. 
2. In the Grid Settings menu, enable or disable certain stats from being shown in the grid.
3. Use the Lower Threshold and Upper Threshold boxes to set the limits for these stats to determine when and what color warnings will show. 
Quick Tip: You can leave these boxes blank to disallow color warnings.
4. Click the Save button. ![]()
Set Your Service Level Agreement Threshold
In some Call Centers, it may be necessary to establish a Service Level Agreement (SLA) that determines how quickly calls should be answered by agents to meet set expectations and standards.
In reports that are viewed in the Call Center page of the Stratus Web Portal, the percentage of how many calls are meeting the Service Level Agreement can be referenced as the Service Level (SL) statistic. The Abandon Rate (AR) will be deducted from the service level percentage. For example, if you have 100% of calls hitting Service Level, but you have an Abandon Rate of 2.1%, your Service Level would be 97.9%.
To adjust the Service Level Agreement that will determine how the Service Level statistic is measured…
- Navigate to the Call Center page.

- On the Call Center page, click the Settings button.

- On the General tab, use the Service Level Agreement slider to specify the amount of time (in seconds) that a call should be answered to meet your standards.

This value will be used to calculate the Service Level Percentage statistic.Note: By default, the Service Level Agreement is set as 60 seconds.
- Click the Save button.

✔ Now the Service Level (SL) statistic will more accurately represent how many handled calls are answered within the set Service Level Agreement.
This statistic can be viewed in the Stats Grid:

Or the Queue Stats Report:

Create Custom Statuses
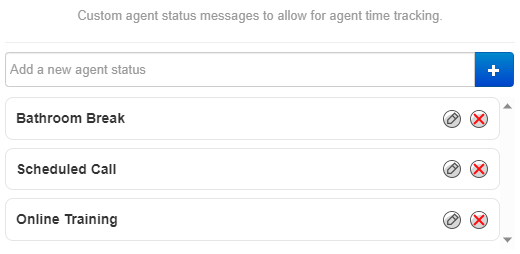
If your agents are supposed to be setting their status for reporting purposes, custom statuses can be created to allow your agents to more accurately report why they are unavailable for calls at certain times.
To add new custom statuses…
- Click the Settings button.

- Go to the Custom Statuses tab.

- In the Add a new agent status box, type the name of a status for your agents to use and click Add.

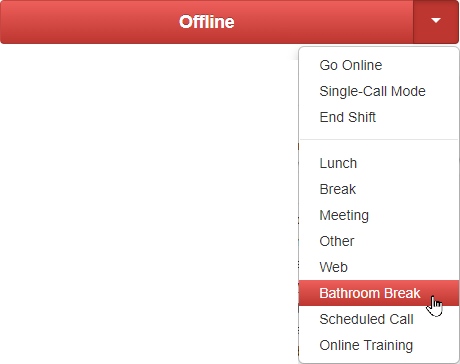
✔ Now you can have a list of statuses.
Your agents can now select these statuses when they are making themselves unavailable for calls.
Call Center Reports
The Portal can generate custom reports about call queues. These reports provide a graphical overview of call center statistics over a given period of time. The reports can cover the entire call center, queues, or individual agents. This granularity enables call center supervisors to monitor their call center.
View Call Center Reports
- On the Call Center page, click the Reports button.

- Use the tabs to select what type of report you want to view.

The types of reports that can be viewed include…- Queue Stats
- Agent Stats
- Agent Availability
- Dialed Number (DNIS) Stats
- Abandoned Calls
- Select the date range and times for calls and their statistics.

Types of Call Center Reports
The Reports page of Call Center can show you several different reports that can be used to monitor how your queues and agents are handling calls.
Queue Stats Report
The Queue Stats report allows supervisors to view specific attributes on a queue-by-queue basis based on user-configurable attributes.

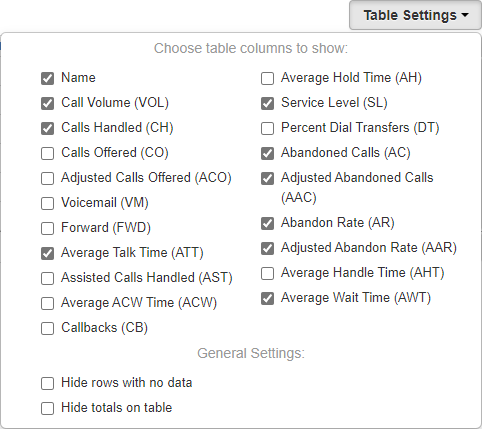
Add or Remove Stats from the Table
The Table Settings button can be used to select the statistics that will be showing in the table.
| Statistic | Description |
|---|---|
| Call Volume (VOL) |
Total number of calls originating through a Call Queue. Includes calls answered/retrieved by agents, abandoned calls, calls forwarded to a queue's forwarding destination for unanswered calls, and calls connected to an agent's voicemail. • Call Volume (VOL) = Calls Offered (CO) + Forward (FWD) + Abandoned Calls (AC) |
| Calls Handled (CH) |
Number of calls originating from a call queue that are answered/retrieved by an agent and handled through ending or transferring the call. This also includes calls that were connected to an agent's voicemail. Excludes abandoned calls and calls forwarded to a queue's forwarding destination for unanswered calls. • Calls Handled (CH) = Calls Offered (CO) - Abandoned Calls (AC) - Forward (FWD) |
| Calls Offered (CO) |
Total number of calls that reached the queue to be dispatched to agents. Includes abandoned calls and assisted calls. |
| Adjusted Calls Offered (ACO) |
Total number of calls that reached the queue. This statistic is adjusted to exclude calls that were abandoned in less than 10 seconds. • Adjusted Calls Offered (ACO) = Calls Offered (CO) - Adjusted Abandoned Calls (AAC) |
| Voicemail (VM) |
Number of calls handled by the automated voicemail system. Only triggered if the caller leaves an audible voicemail at a traditional or system/functional extension. |
| Forward (FWD) |
Number of calls forwarded to a queue's forwarding destination for unanswered calls, such as an agent's voicemail, another queue, or an offnet phone number for handling. Must have a voicemail, queue, or offnet (external) phone number set as FWD Destination in the “In Queue Options” for this to be triggered. |
| Avg Talk Time (ATT) |
Average number of minutes spent by agent talking per call on calls originating through a Call Queue. Excludes hold time. |
| Avg After Call Work (ACW) | Average time an agent spends between the end of a call and submitting call disposition. |
| Avg Hold Time (AH) | Average time a caller spends on hold with an agent. Excludes waiting time in the Call Queue. |
| Service Level (SL) |
Percentage of calls answered originating through the queue within a set amount of time. The default is 60 seconds, but other time windows are available. The Abandon Rate (AR) will be deducted from the service level percentage. For example, if you have 100% of calls hitting Service Level, but you have an Abandon Rate of 2.1%, your Service Level would be 97.9%. |
| Dial Transfers (DT) | Percentage of calls that landed in the queue and were offered to an agent. |
| Abandoned Calls (AC) |
Number of calls that abandoned the queue before being offered to an agent. Only triggered if the caller disconnects while the queue is ringing the agents; not during any voicemail greeting or automated system voice-over message within the call flow. |
| Adjusted Abandon Calls (AAC) |
Adjusted number of calls that abandoned the queue. Excludes calls abandoned in less than 10 seconds. (Abandoned Calls) - (Number of calls abandoned in less than 10 seconds) |
| Abandon Rate (AR) |
Percentage of calls offered that were abandoned. Abandoned Calls (AC) / Calls Offered (CO). |
| Adjusted Abandon Rate (AAR) |
Percentage of calls offered that were abandoned by the incoming caller after ringing for 10+ seconds. Adjusted Abandoned Calls (AAC) / Adjusted Calls Offered (ACO). |
| Avg Handle Time (AHT) |
Average time an agent spent on a call. Includes Talk Time (TT), Hold Time (AH), and Disposition Time (ACW) |
| Avg Wait Time (AWT) | Average time calls are waiting in the queue before an agent answers. This can be thought of as the Average Answer Speed. |
Change the Stat Shown in the Graph
The line graph shown in the Report page will display one stat at a time. The stat shown can be adjusted.
To pick a different stat to be shown in the line graph, click Call Volume and select the stat that should be shown.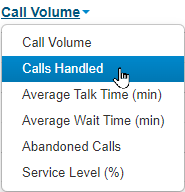
Color Code the Graph
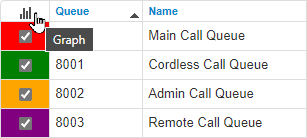
You can click the checkboxes in the first column for Call Queue statistics to color-code the graph to better visualize the activity for each queue.

Quick Tip: Clicking the Graph  icon will toggle all of the checkboxes on/off.
Agent Stats Report
The Agent Stats report shows statistics for each agent in your queues.

Filter Agent Data
To make sorting through your agents' data easier, you can filter the agents shown in the table and graph.
There are two ways that you can filter your agents:
1. Use the Department drop-down to only show agents in a certain Department.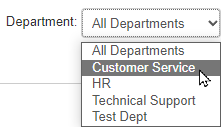
2. Use the Queue drop-down to only show agents in a certain Call Queue.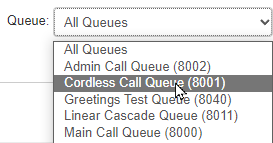
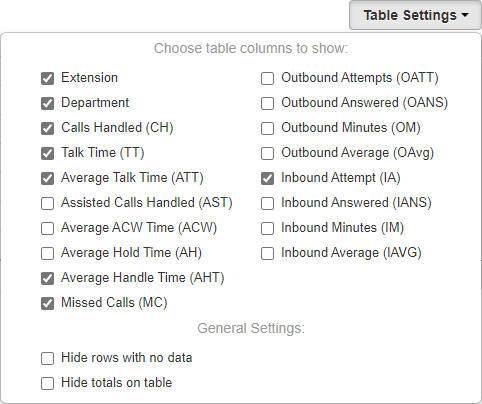
Add or Remove Stats from the Table
The Table Settings button can be used to select the statistics that will be showing in the table.
| Statistic | Description |
|---|---|
| Calls Handled (CH) |
Number of calls an agent answers from a queue and then handles through transferring, parking, or the call ending (by the caller or agent). This includes calls that go to an agent's voicemail and forwards. |
| Avg Talk Time (ATT) |
Average number of minutes spent by agent talking per call on calls originating through a Call Queue. Excludes hold time and wait time. |
| Avg After Call Work (ACW) | Average time an agent spends between the end of a call and submitting a call disposition. |
| Avg Hold Time (AH) | Average time a caller spends on hold with an agent. Excludes waiting time in the Call Queue. |
| Avg Handle Time (AHT) |
Average time an agent spent on a call. Includes Talk Time (TT), Hold Time (AH), and Disposition Time (ACW) |
| Calls Assisted (AST) | Number of calls answered and passed onto a different agent for further handling. Agents who handled the queued call but were not the final handler will be given an assist count. |
| Outbound Attempt (OATT) |
Number of outbound call attempts by agent. Excludes on-net calls and conference calls. |
| Outbound Answered (OANS) |
Number of outbound calls by agent answered by a remote party. Includes calls answered by voicemail. Excludes on-net calls and conference calls. |
| Outbound Minutes (OM) |
Number of minutes spent by agent on outbound calls. Excludes call center calls, on-net calls, and conference calls. |
| Outbound Average (OAvg) |
Average length of time spent by agent on outbound calls. Excludes call center calls, on-net calls, and conference calls. |
| Inbound Answered (IANS) |
Counts any call that an agent picks up that originated through a queue. This includes calls that were previously handled by another agent, such as parked calls. Excludes on-net calls and conference calls. |
| Inbound Calls Today (IA) | Number of calls that were dispatched to an agent from a queue. Calls that were dispatched and abandoned or not answered will be counted. This includes calls that were previously handled by another agent, such as parked calls. Excludes on-net calls and conference calls. |
| Inbound Minutes (IM) |
Number of minutes spent by an agent on inbound calls from a call queue. Excludes on-net calls and conference calls. |
| Inbound Average (IAVG) |
Average length of time spent by an agent on inbound calls. Includes call center calls. Excludes on-net calls and conference calls. |
| Missed Call (MC) | Number of calls originating through a call queue offered to an agent but not answered. This includes multiple attempts if a call loops through all agents but excludes unanswered simultaneous ring calls. |
Change the Stat Shown in the Graph
The line graph shown in the Report page will display one stat at a time. The stat shown can be adjusted.
To pick a different stat to be shown in the line graph, click Call Volume and select the stat that should be shown.
Color Code the Graph
You can click the checkboxes in the first column for Call Queue statistics to color-code the graph to better visualize the activity for each queue.

Quick Tip: Clicking the Graph  icon will toggle all of the checkboxes on/off.
Agent Availability Report
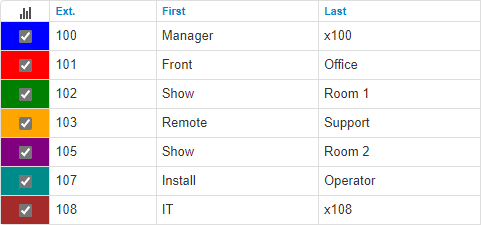
The Agent Availability report shows a breakdown of how long each agent in a queue has been on different statuses.

Show Specific Statuses
The Table Settings button can be used to select the default and custom statuses that will be showing in the table and graph. 
Filter Agent Data by Department
If needed, the agents shown in the Agent Availability report can be filtered to help declutter and simplify your view of the table and graph.
Use the Department drop-down to view the availability data of agents in specific Departments. 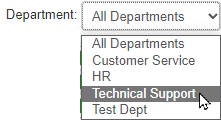
Dialed Number Stats Report
The Dialed Number (DNIS) Stats report shows information based on the Dialed Number Identification Service (DNIS). DNIS is a telephone service that informs the receiver about a call that the caller dialed. DNIS is a common feature utilized by 800 and 900 services.

If you have multiple 800 or 900 numbers to the same destination, the DNIS tells you which number was called and how it was dialed. .
.
Adjust Dialed Numbers Shown
You can click the checkboxes in the first column for Call Queue statistics to hide/show specific numbers dialed in the graph.

Quick Tip: Clicking the Graph  icon will toggle all of the checkboxes on/off.

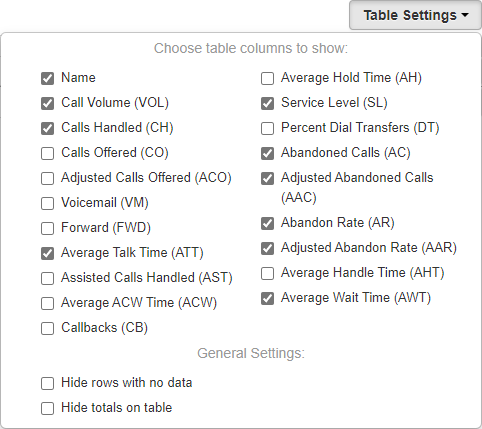
Add or Remove Stats from the Table
The Table Settings button can be used to select the statistics that will be showing in the table.
| Statistic | Description |
|---|---|
| Call Volume (VOL) |
Total number of calls originating through this phone number that is dispatched to one or more queues. Includes calls answered/retrieved by agents, abandoned calls, calls forwarded to a queue's forwarding destination for unanswered calls, and calls connected to an agent's voicemail. • Call Volume (VOL) = Calls Offered (CO) + Forward (FWD) + Abandoned Calls (AC) |
| Calls Handled (CH) |
Number of calls originating from a call queue that are answered/retrieved by an agent and handled through ending or transferring the call. This also includes calls that were connected to an agent's voicemail. Excludes abandoned calls and calls forwarded to a queue's forwarding destination for unanswered calls. • Calls Handled (CH) = Calls Offered (CO) - Abandoned Calls (AC) - Forward (FWD) |
| Calls Offered (CO) |
Total number of calls that reached the queue to be dispatched to agents. Includes abandoned calls and assisted calls. |
| Adjusted Calls Offered (ACO) |
Total number of calls that reached the queue. This statistic is adjusted to exclude calls that were abandoned in less than 10 seconds. • Adjusted Calls Offered (ACO) = Calls Offered (CO) - Adjusted Abandoned Calls (AAC) |
| Voicemail (VM) | Number of calls handled by the automated voicemail system. |
| Forward (FWD) | Number of calls forwarded to a queue's forwarding destination for unanswered calls, such as an agent's voicemail, another queue, or an offnet phone number for handling. |
| Avg Talk Time (ATT) |
Average number of minutes spent by agent talking per call on calls originating through a Call Queue. Excludes hold time. |
| Avg After Call Work (ACW) | Average time an agent spends between the end of a call and submitting call disposition. |
| Avg Hold Time (AH) |
Average time a caller spends on hold with an agent. Excludes waiting time in the Call Queue. |
| % Service Level (SL) |
Percentage of calls answered originating through the queue within a set amount of time. The default is 60 seconds, but other time windows are available. The Abandon Rate (AR) will be deducted from the service level percentage. For example, if you have 100% of calls hitting Service Level, but you have an Abandon Rate of 2.1%, your Service Level would be 97.9%. |
| % Dial Transfers (DT) | Percentage of calls that landed in the queue and were offered to an agent. |
| Abandoned Calls (AC) | Number of calls that abandoned the queue before being offered to an agent. |
| Adjusted Abandon Calls (AAC) | Adjusted number of calls that abandoned the queue. Excludes calls abandoned in less than 10 seconds. (Abandoned Calls) - (Number of calls abandoned in less than 10 seconds) |
| Abandon Rate (AR) |
Percentage of calls offered that were abandoned. (Abandoned Calls AC) / (Calls Offered CO). |
| Adjusted Abandon Rate (AAR) |
Percentage of calls offered that were abandoned by the incoming caller after ringing for 10+ seconds. (Adjusted Abandoned Calls AAC) / (Adjusted Calls Offered ACO). |
| Avg Handle Time (AHT) |
Average time an agent spent on a call. Includes Talk Time (TT), Hold Time (AH), and Disposition Time (ACW) |
| Avg Wait Time (AWT) | Average time calls are waiting in the queue before an agent answers. This can be thought of as the Average Answer Speed. |
Change the Stat Shown in the Graph
The line graph shown in the Report page will display one stat at a time. The stat shown can be adjusted.
To pick a different stat to be shown in the line graph, click Call Volume and select the stat that should be shown.
Filter DNIS Data by Queue
Use the Queue drop-down to only show the stats for numbers that direct callers to a certain Call Queue.
Abandoned Calls Report
The Abandoned Calls report shows a graph and data about calls that have been recorded as abandoned.

Note: Time is measured along the x-axis and the number of calls abandoned is measured along the y-axis.
Each abandoned call and the information about these calls are shown in the table. The data shown includes…
• Date and time of the abandoned call.
• The From Name of the caller.
• The phone number of the caller (From)
• The on number and name of the Queue the abandoned call originated from.
• The number dialed by the caller of the abandoned call.
• How long (in seconds) the caller waited before abandoning the call.
These abandoned calls are usually the result of callers hanging up before their call is answered, or from their call dropping due to technical issues. Most abandoned calls occur in the first 10 seconds (2 rings) of a call.
Filter Abandoned Calls by Queue
Use the Queue drop-down to only abandoned calls recorded for a certain Call Queue.
Schedule Emailed Reports
If needed, you can have reports of your call center statistics automatically sent to your email. This can be helpful for record-keeping.
To schedule emails for your call center reports…
- Click the Email Reports button.

- On the Basic tab of the Email Reports menu select the Types of reports that should be included in the emailed report.

- In the Frequency section, select when you would like to receive reports by email.

- Use the dropdowns that appear to further specify when the reports should be sent.

- A daily report will require the supervisor to set a time.
- A weekly report will require the supervisor to set a day of the week and time.
- A monthly report will require a day of the month and send the previous month's data on that day. Set this to "1" to receive a report of the full previous calendar month.
Note: The Send Time will be followed for Monthly, Weekly, and Daily reports.
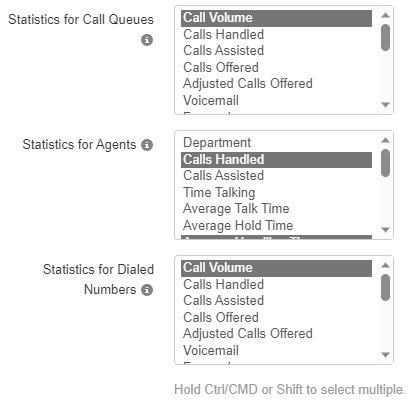
- In the Advanced tab that appears, use the Statistics sections for each type of report to select the stats that should be shown for each report.
- Use the Extra Email Addresses section to type the email addresses of people that should receive the reports.

Note: Up to 4 different email addresses can be added.
- If you would like a CSV spreadsheet of raw data including all available statistics attached to the email, select Attach CSV data to email.

- Click the Save button. The email reports will then be scheduled.

✔ Emailed Reports will arrive at the email address provided with the requested information in the body of the message.
